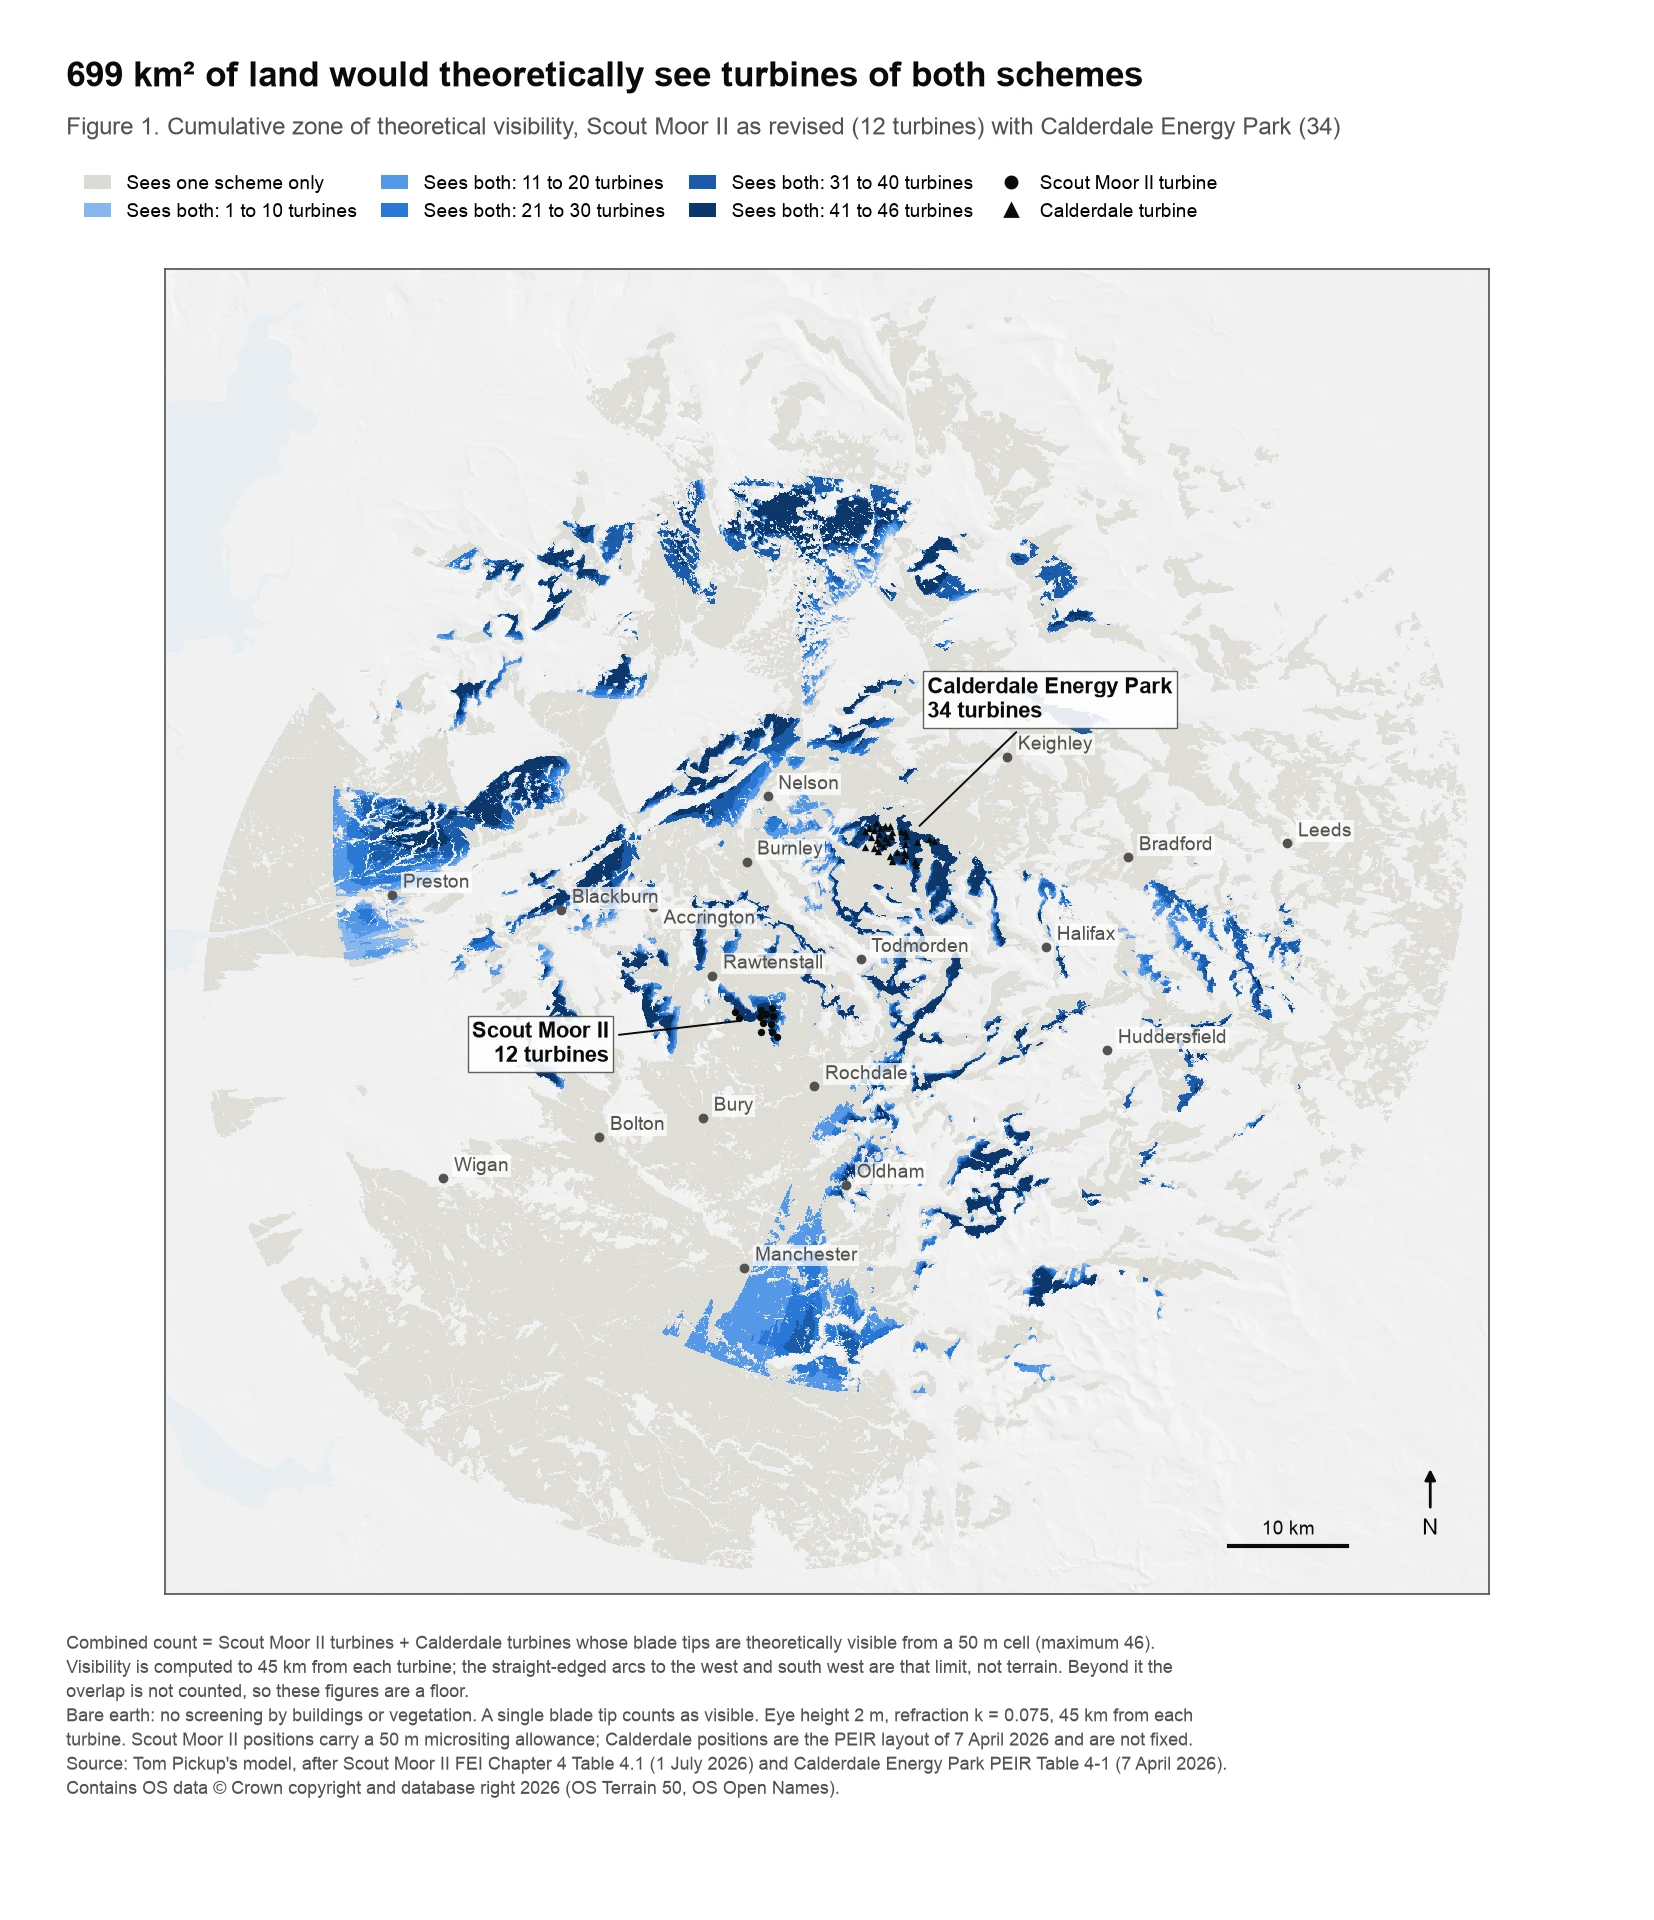
Scout Moor II has been cut from 17 turbines to 12. And the applicant’s own map of where it and Calderdale Energy Park, up to 34 turbines above Hebden Bridge, could be seen together is now public. On my model, the area that could theoretically see turbines of both barely shrinks: from 700.8 square kilometres to 698.9.
That map is the thing I said did not exist. In August I wrote that there was no assessment of the two schemes together. I was wrong about that, and I have said so in a correction to that article.
What the applicant’s assessment leaves out
It assessed no settlement for the combined view. The applicant’s assessment says its combined map “rules out settlements within the assessment”. That is true of the fourteen settlements it assessed, all within about 10 kilometres of the site: none of them can see Calderdale. But within its own 20 kilometre cumulative radius, 69 named places could see both wind farms on bare ground, 62 of them inside its own “both may be visible” colour, and none of them was assessed. Across the whole overlap I count 206 places, 198 of them in that colour, 60 of those in Lancashire.
Those are bare-earth figures at the map point for each place, and I tested them against the Environment Agency’s laser-scanned surface model, which includes buildings and trees. At the map point itself, which is usually a street, the surface takes the combined view away at 49 of the 51 highest-scoring places. Within 100 metres of the point, on a recreation ground or a higher street, 17 of the 51 keep it, 14 of them with 20 or more turbines in view. So the question is not whether every street would see both wind farms. It is why the applicant did not pick a single settlement to find out.
Its map gives no counts. The map shows where both schemes may be visible. It does not say how many turbines, over how much land, or from which places. My model does.
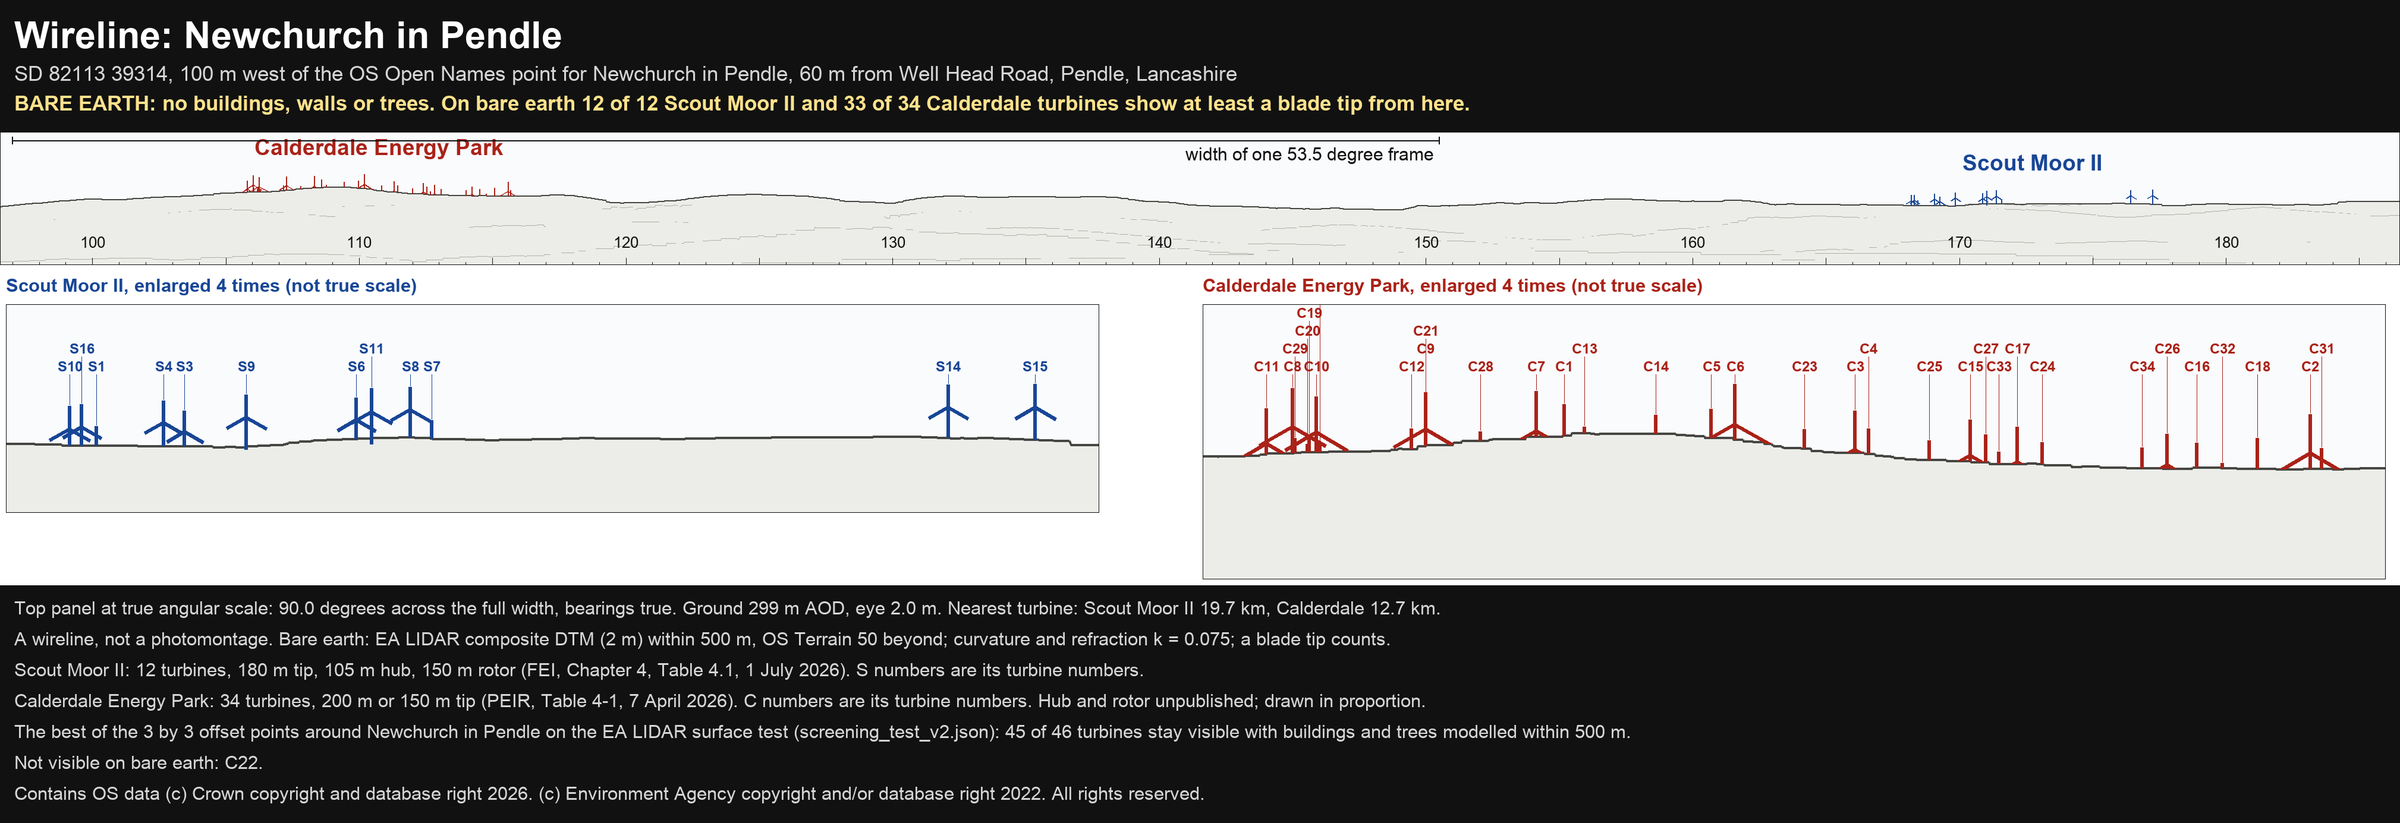
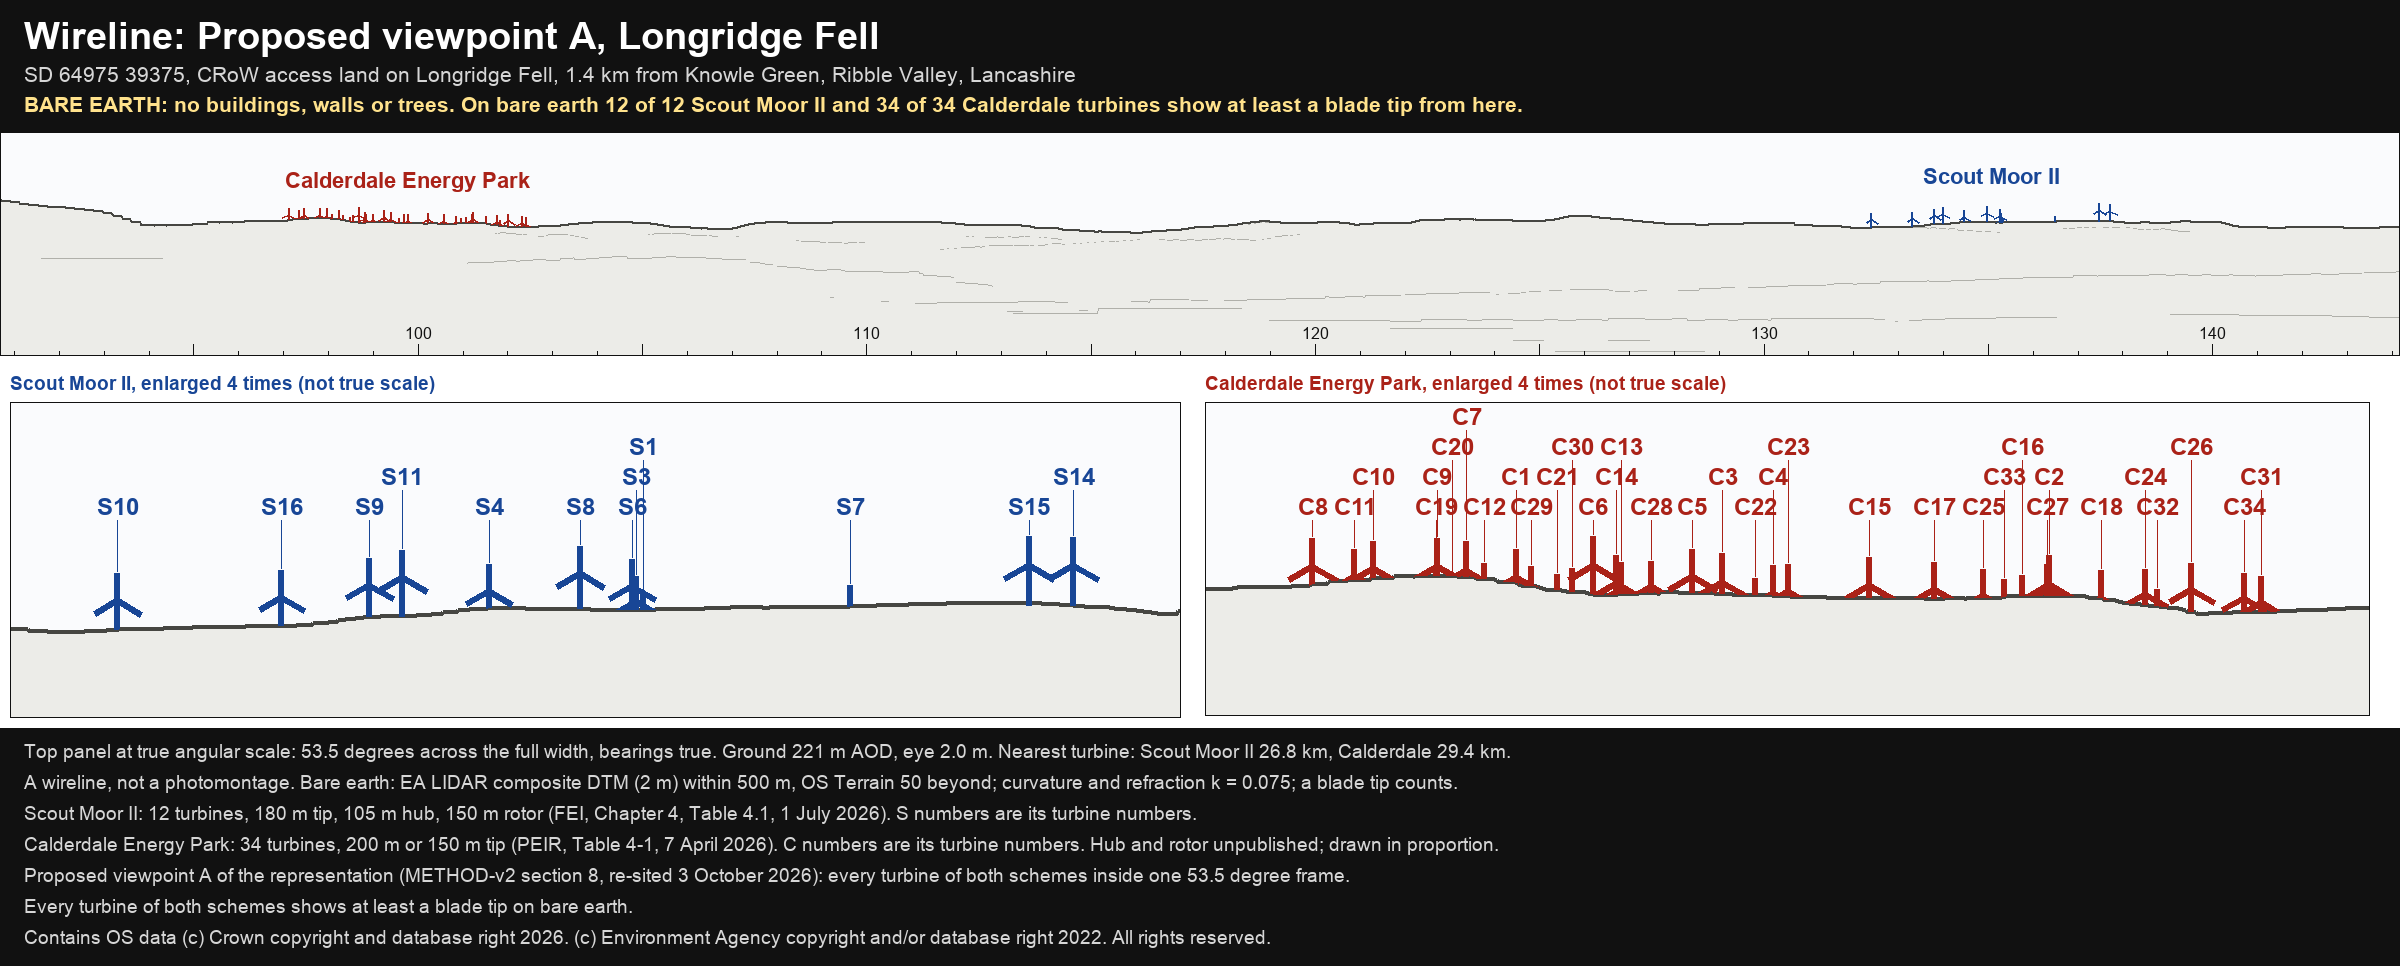
None of its combined viewpoints is in Preston or Hyndburn. Of the 63 Lancashire places in the overlap, 44 are in those two districts, and 29 of the 63 are more than 30 kilometres from the nearest Scout Moor II turbine. I have proposed five more viewpoints, chosen by a stated rule and checked against the surface model so that none is proposed from behind a wood. Two are in the Forest of Bowland National Landscape, and from each all 46 turbines are theoretically visible inside one photomontage frame.
There is no night-time assessment of the two together. Both schemes need red aviation lights. The applicant’s combined assessment does not mention them.
Calderdale’s own map supports the model at five Lancashire places
In August I flagged that my model showed more Calderdale turbines than Calderdale’s own settlement table at Hapton, Altham, Higham, Rishton and Huncoat, and that I could not explain why. I can now. Calderdale’s own published visibility map shows between 22 and 34 turbines theoretically visible at all five. It is the table, not the model, that is out of line with Calderdale’s own map.
What I am asking for
I have sent a fresh representation to Rossendale and Rochdale. It asks the councils to:
- require the data behind the applicant’s combined map, or accept mine;
- have the applicant pick settlements from its own combined map and assess them;
- add five combined viewpoints, including in Lancashire;
- require a combined night-time assessment;
- publish their own landscape consultant’s review;
- confirm the dates the new documents went public and the earliest date each council can now decide. The councils’ letters say 23 October, Rochdale’s newspaper notice says 22 October and Rossendale’s says 1 November;
- send the application to committee, not decide it under delegated powers. The national scheme of delegation starts on 31 October, makes no transitional provision for applications already made, and leaves it to one councillor and one officer to agree that this one goes to committee.
Rossendale’s newspaper notice of 2 October gives 1 November for comments on the revised environmental statement, and I have asked both councils to accept comments until then. Do not rely on that: Rochdale’s own notice gives 22 October, so send yours by 22 October 2026. The documents are on Rossendale’s planning portal under 2025/0267 and Rochdale’s under 25/00680/FUL. Rossendale takes comments at planning@rossendalebc.gov.uk and Rochdale at development.management@rochdale.gov.uk. Say which application you are commenting on, and ask for it to be logged on both.
What changed, and what did not
Removing five turbines is a real change and I welcome it. On the applicant’s own figures the scheme would now be at least 68.4 megawatts and up to 84, which it says is enough to power 84,552 typical homes a year. Eight of the 12 turbines would carry a red aviation light, where before it was eight of 17.
What barely changed is the area that could see both.
About 700 square kilometres of land would theoretically see turbines of both schemes. On my model it was 700.8 with 17 turbines and is 698.9 with 12. That is a change of 0.3 per cent. The August article gave 702 for 17 turbines; 700.8 is the same model re-run with one rule for setting every turbine’s ground level, bilinear interpolation of the Ordnance Survey terrain at each turbine, so that the two layouts are compared like for like. The method note sets it out. In the applicant’s own mapping software, given the same inputs, it is 685.
The overlap is set by the shape of the land and the distance between the two sites, not by how many turbines there are.
These are theoretical figures. They assume bare earth, with no buildings, walls or trees in the way, and count a single blade tip as visible. They show where the turbines could be seen, not what you would see on a given day.
What I got wrong
The applicant, a company backed by Cubico Sustainable Investments, sent both councils further environmental information, a revision of its environmental statement, under a letter of 1 July 2026. It already included a written cumulative assessment of Calderdale Energy Park and a combined map. The 12-turbine layout was in the same submission.
None of it was on the public planning portal when I wrote. By my count on 20 August the Rossendale file listed 333 documents and none of them was part of the revision; on 4 September the case officer told me the documents would be viewable once the re-consultation went live; the councils’ letters are dated 25 September and the portal gives 28 September. So it was true that nothing had been published. But my headline and my objection both said that no assessment existed, and that was wrong.
I also said no independent review of the landscape chapter had been commissioned. The applicant records that the councils had commissioned one, from the consultancy LUC, and dates LUC’s draft to February 2026. It has not been published either, and I am asking for it.
Read it yourself
The representation runs to 12 pages, with three appendices: the method, the full list of places with their counts for 17 and 12 turbines, and the comparison with the applicant’s map. Its section 3 sets out, openly, where my August objection was wrong.
Sent to Rossendale Borough Council and Rochdale Borough Council on 4 October 2026, copied to the Planning Casework Unit at the Ministry of Housing, Communities and Local Government. The data and code are available to anyone who wants to check them.
Method and sources
Turbine positions are from the Scout Moor II Further Environmental Information, Chapter 4, Table 4.1 (covering letter of 1 July 2026), and the Calderdale Energy Park preliminary environmental information report, Table 4-1 (7 April 2026). Terrain is OS Terrain 50, the Ordnance Survey national bare earth model, under the Open Government Licence; settlement points are from OS Open Names. The grid is 50 metre cells, observer eye height 2.0 metres, refraction coefficient 0.075, visibility computed to 45 kilometres from each turbine and judged on blade tip. Scout Moor II positions carry the 50 metre micrositing allowance the applicant states, and Calderdale Energy Park’s positions are not yet fixed. The cross-check in the applicant’s own software used the Viewshed routine of the Visibility Analysis plugin for QGIS, version 1.9.3. The surface test used the Environment Agency’s National LIDAR Programme composite surface and terrain models at 2 metres. The applicant’s figures and words are from its Further Environmental Information: Chapter 4, paragraph 4.139 (capacity); Chapter 11, paragraphs 11.37 (the 20 kilometre radius), 11.288 (the fourteen settlement groups), 11.487 (lighting) and 11.549 (the quotation); Chapter 15, paragraphs 15.46 and 15.73 (output and homes); and Appendix 2.4 (LUC’s draft review). The earlier lighting figure, eight of 17, is from its 2025 environmental statement, Chapter 11, paragraph 11.480. Calderdale’s map and table are its preliminary environmental information report, Figure 12-5-1 and Table 12-9. Contains OS data © Crown copyright and database right 2026. © Environment Agency copyright and/or database right 2022.
This representation is made in a personal capacity and as county councillor for Padiham and Burnley West. It is not made on behalf of Lancashire County Council and does not represent the county council’s position.