The Office for National Statistics published an article this morning explaining where data centres appear in the UK national accounts. The answer is that they appear everywhere and nowhere.
Construction of a data centre lands in “private industrial new work”, the same line as factories and warehouses, “because they are not separately identifiable”. Imported servers land in the trade figures with nothing recording where they are going. Investment can surface under information and communication, real estate or financial services depending on who owns the asset. The article’s own summary is that ONS is “currently unable to separately identify either the investment in or output of data centres”, and that at every stage of a data centre’s life “data centres are not separately visible”.
This is ONS being straight about a limitation and setting out to fix it, which is to its credit. But it has a consequence. Any claim about what data centres are contributing to British growth, investment or employment currently cannot be checked against the national accounts, because the national accounts do not contain a data centre.
That would matter less if the sector were small or static. It is neither.
A queue fourteen times the forecast
The National Energy System Operator, which runs Great Britain’s grid, submitted written evidence to the Environmental Audit Committee setting out what is in front of it.
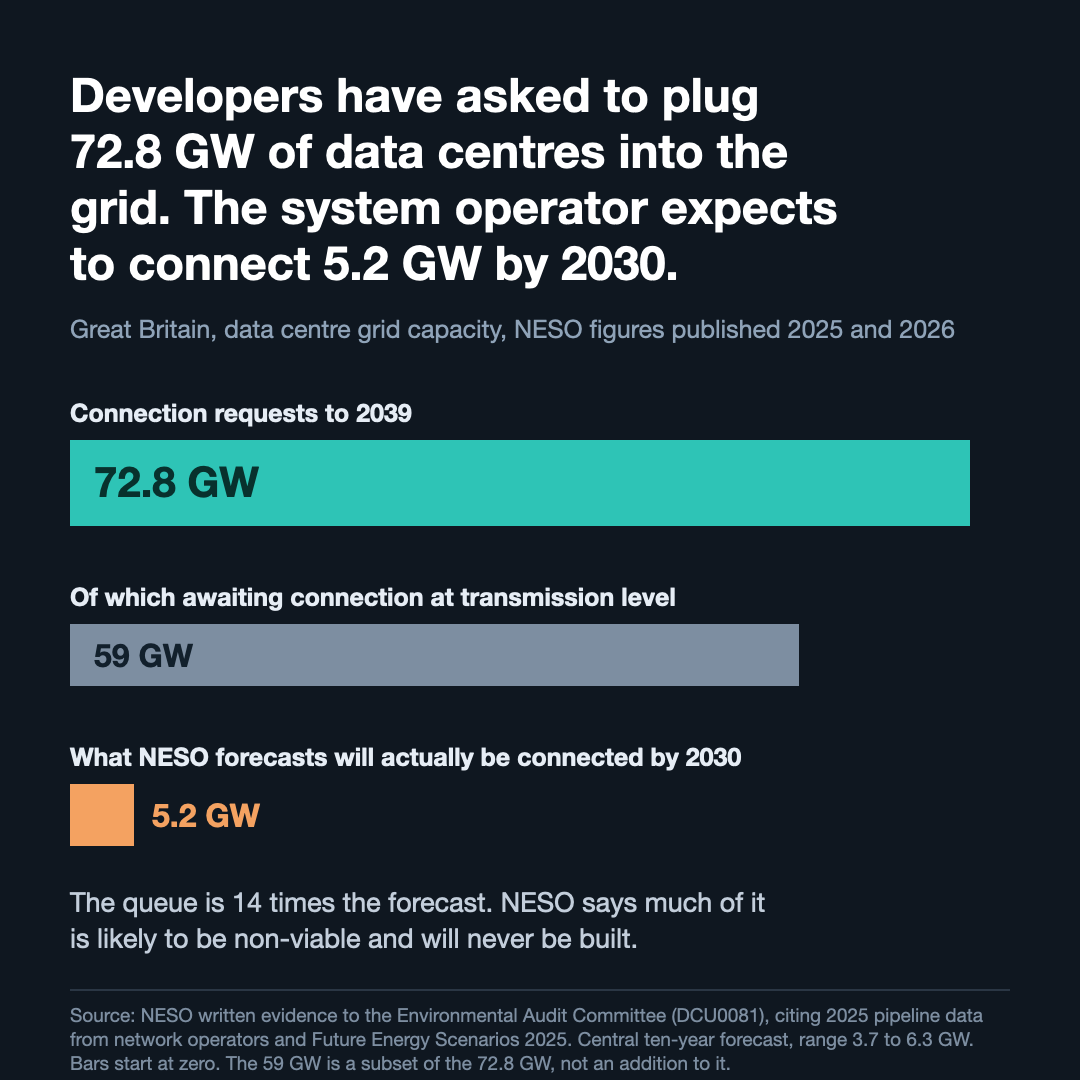
Pipeline data collected in 2025 from distribution and transmission network operators shows around 72.8 GW of data centre connection requests through to 2039. NESO’s own ten-year forecast for what will actually be connected by 2030 is 5.2 GW, with a range in its Future Energy Scenarios 2025 of 3.7 to 6.3 GW, producing annual consumption in 2030 of just over 20 TWh.
The queue is fourteen times the central forecast. NESO is explicit that it does not expect all of it to arrive: the pipeline “contains a number of projects likely to be non-viable”, and outcomes are uncertain because of project attrition, seven-year average ramp rates and variable utilisation. Nobody should quote 72.8 GW as demand.
What the queue does show is a change of kind, not just of scale. In 2025 the average data centre in Great Britain was 12 MW and almost all sat on the local distribution network. Today nearly 59 GW is waiting at transmission level, 57.8 GW of it in projects of 100 MW or more, and 40 of the 173 transmission projects are between 500 and 1,500 MW.
So the state is being asked to connect a great deal of something it has just confirmed it cannot separately measure.
Where they go, and who pays
NESO is blunt about the geography. Most existing data centres sit around London and the South East, which it says “resulted in additional network pressures for some areas”.
The energy department’s numbers show how concentrated that is. Data centres consumed an estimated 4.5 TWh in Great Britain in 2024, 2% of the 249.2 TWh drawn from the grid. The South East took 1.8 TWh and London 1.7 TWh, 77% between them. Slough alone accounted for 1.3 TWh, 29% of the national total, and in Slough data centres took “almost two-thirds (65%) of all electricity consumed from the grid”. Everywhere else in Great Britain managed 1.0 TWh between them. Slough on its own is larger than all of it.
The growth runs the same way. Between 2020 and 2024 consumption rose 57% in the South East and 46% in London. Outside those two regions it rose 15%.
This is where it stops being an argument about somebody else’s town. NESO sets out what siting these things near spare network capacity and renewable generation would do:
By locating data centres behind constrained points on the electricity network, renewable generation can be used locally before it reaches congested points. This avoids having to curtail wind output and subsequently increase gas-fired generation elsewhere due to constraints on the network, which is more expensive and results in higher emissions.
More expensive. Curtailment payments and constraint costs are not absorbed by the region that causes them. They are recovered across the system, which means every bill. NESO’s judgement is that strategic siting “will deliver the maximum system benefit”, and its expectation is that a maximum of 20% of future data centre demand ends up in Scotland.
The North has wind and it has network headroom. On the published evidence it is getting neither the buildings nor the benefit, while carrying a share of the cost of congestion four hundred miles away.
The four words nobody assessed
On 7 January the Ministry of Housing, Communities and Local Government made Statutory Instrument 2026 No. 13, the Infrastructure Planning (Business or Commercial Projects) (Amendment) Regulations 2026. It came into force the next day, having been approved by resolution of both Houses.
The operative change is one line. In the Schedule to the 2013 Regulations, after paragraph 9 (Tourism), insert “10. Data centres.”
It is worth being precise about what that does, because it has been overstated elsewhere. It does not make data centres automatically nationally significant. It adds them to the prescribed descriptions of project that can seek a direction under section 35 of the Planning Act 2008, and the Secretary of State can only give that direction if the Secretary of State thinks the project is of national significance. The default route through the local planning authority remains.
What it does is open a door that was shut. Before January, whatever its size, a data centre went to the council. Now a developer can ask a minister to take the decision instead.
The explanatory note to the instrument says this:
A full impact assessment has not been produced for this instrument as no, or no significant impact on the private, voluntary sector or community bodies is foreseen.
That is a standard de minimis statement and it should be read as one. It concerns regulatory burden on business, the voluntary sector and community bodies. It is not a finding that residents, councils or local planning outcomes are unaffected, and it should not be quoted as though it were. What it does mean is that a new category of nationally significant infrastructure was created without a full impact assessment being produced.
The three together
A sector the national statistician cannot separately identify. A connection queue fourteen times what the grid operator expects to build, concentrated in the corner of the country with the least room for it. A faster consenting route, opened without an impact assessment.
None of that is an argument against data centres. Britain needs computing capacity and is going to build a great deal more of it. It is an argument about where it goes, who decides, and whether anyone is counting.
Sources
- ONS, Data centres and the UK National Accounts, 24 August 2026.
- NESO, written evidence to the Environmental Audit Committee, DCU0081, citing 2025 network operator pipeline data and Future Energy Scenarios 2025: Pathways to Net Zero.
- DESNZ, Data centre electricity consumption in Great Britain, 2020 to 2024, Special article, Energy Trends collection, 30 June 2026. Official Statistics in Development.
- The Infrastructure Planning (Business or Commercial Projects) (Amendment) Regulations 2026, SI 2026 No. 13, made 7 January 2026, in force 8 January 2026.
Caveats
The two electricity figures are not measuring the same thing, and DESNZ says so. NESO has published 7.6 TWh for total data centre consumption in Great Britain in 2023, built from data centre capacities with assumptions about utilisation. DESNZ’s estimate for the same year, built instead from meter-level data on electricity actually consumed, is 4.1 TWh. A third figure, from DESNZ’s own ND-NEED framework, gives 2.6 TWh for England and Wales in 2023. Three methods, three answers, spanning a factor of nearly three. Any single number for what data centres use should be read with that in mind, and figures from different methods must never be strung together into a trend.
The DESNZ estimates are a floor, not a total. They cover only data centres serving external organisations, that is colocation, managed hosting and hyperscale sites. They exclude enterprise data centres run by an organisation for its own internal use, and they include only sites whose electricity meters could be matched to a known address.
The queue and the forecast have different horizons. The 72.8 GW of requests runs to 2039; the 5.2 GW forecast is for 2030. NESO sets the two against each other in its own executive summary, and both dates are stated above, but the comparison is not like-for-like and should not be presented as one.
Absence from a table is not absence on the ground. DESNZ publishes no separate figure for the North West. That is a gap in the statistics. There are data centres in the region, including clusters around Manchester, Trafford Park and Salford. The point is that there is no published figure for what they use.
NESO’s next ten-year forecast is due in summer 2026 and had not been published when this was written. NESO notes that while connected capacity could increase, updated information on utilisation rates could produce a lower annual energy demand figure.
Figures from DESNZ, ONS and NESO are Crown copyright or published under the Open Government Licence v3.0. Legislation is reproduced under the Open Parliament Licence.