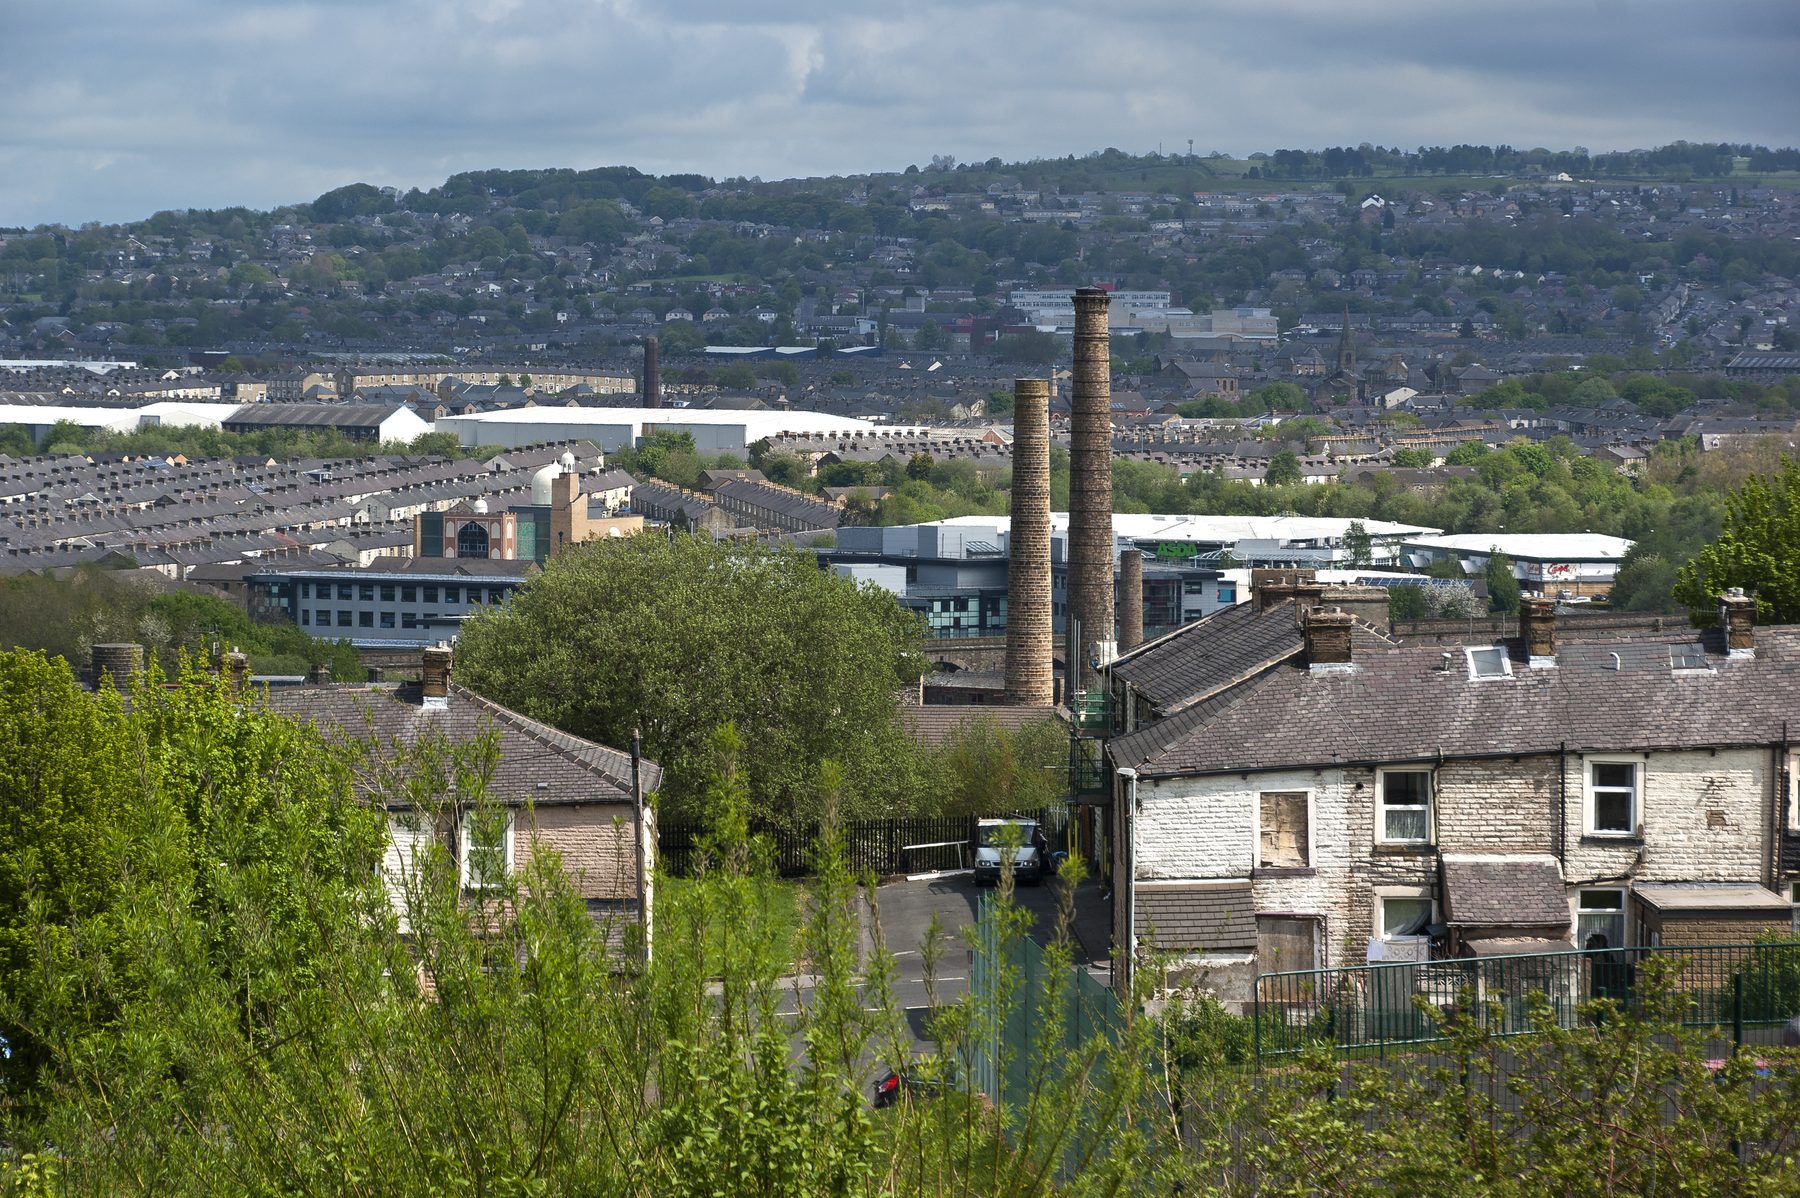
I have written a lot lately about the welfare bill in Burnley: PIP, Motability, Universal Credit. This is the article underneath all of them. Because the benefits are not the story. They are the symptom. The story is a town that gets ill young, is forced out of work by that illness, and dies sooner than almost anywhere in England. The official figures lay it out link by link.
It starts with deprivation
Burnley is now the 4th most deprived district in England, out of 296. The number that should worry everyone is the direction: in 2019 it was 11th. The town is getting more deprived, not less.
That floor sets everything else. 38.3% of Burnley’s children live in a low-income family, against 19.8% across England. On the ONS Health Index, where England scores 100, Burnley scores 85.3, one of the fifteen worst in the country. This is the ground the rest of the chain grows from.
Sick sooner
Poverty makes people ill, and Burnley is ill. One adult in five (20.6%) is disabled under the Equality Act. And people here die of the big killers far younger than the rest of the country.
| Early death, under 75 (rate per 100,000) | Burnley | England | Higher by |
|---|---|---|---|
| Deaths considered preventable | 237.5 | 145.8 | +63% |
| Respiratory disease | 57.5 | 32.4 | +78% |
| Heart disease and stroke | 118.1 | 74.4 | +59% |
| Suicide | 17.8 | 10.9 | +63% |
| Cancer | 147.9 | 117.7 | +26% |
Read the top line again. “Preventable” deaths run 63% above the England rate. By definition, those are deaths that better health, earlier treatment or prevention could have stopped. In Burnley they happen far more often.
Out of work because of it
This is where the welfare numbers come from, and it is the part the national debate gets wrong. Burnley’s employment rate is 71.5%, below the Great Britain figure of 75.5%, and 27% of working-age adults are economically inactive, against 20.8% nationally.
But look at why they are out of work:
5,500 working-age people in Burnley are out of work because they are long-term sick. That is more than one in three of everyone who is economically inactive here, well above the national rate. This is not a town that will not work. It is a town that is too ill to. The high PIP caseload (over 10,000) and the 4,540 who qualify for a Motability car are not a scandal. They are this chain, made visible.
Gone earlier
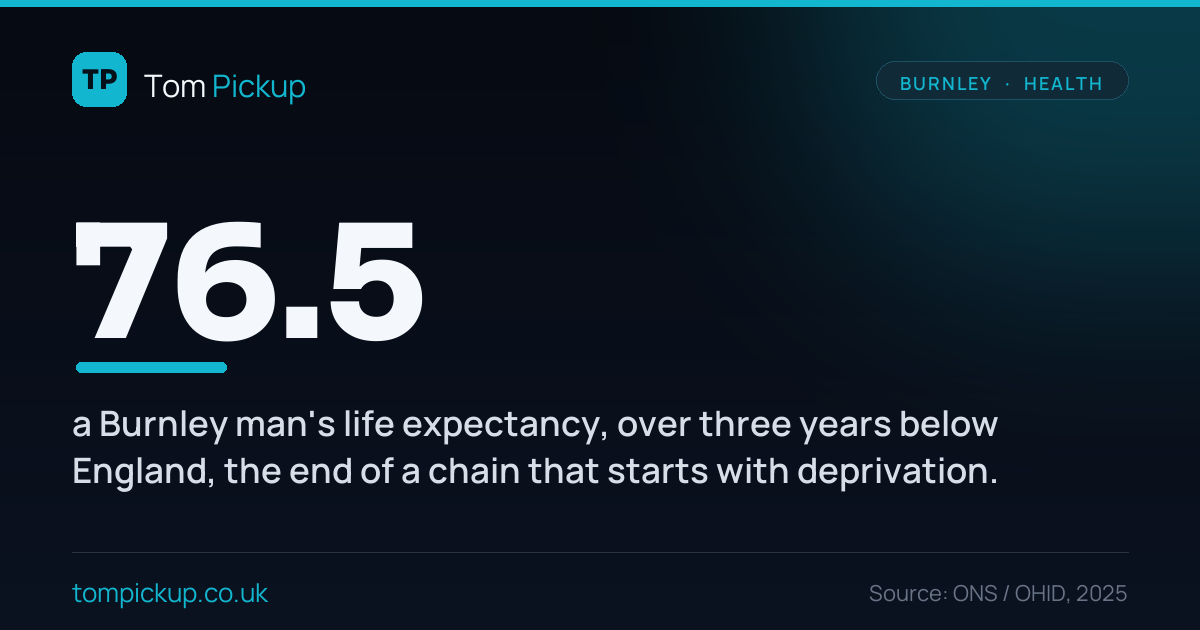
And it ends early. A man born in Burnley can expect to live to 76.5, against 79.7 across England. A woman, 80.4 against 83.5. Those few years are the difference between seeing your grandchildren grow up and not.
The cruellest part is the gap inside the town. Between Burnley’s most and least deprived neighbourhoods, male life expectancy differs by 8.7 years. Two streets, the same town, nearly a decade of life between them.
The healthy years you do not get
There is one figure I cannot give you honestly, so I will say why. Healthy life expectancy, the years you can expect to live in good health, is not published for individual districts like Burnley. For Lancashire as a whole it is 59.3 years for men and 60.3 for women, against 60.9 and 61.3 for England. Set that against a life expectancy in the high 70s and early 80s, and the meaning is stark: people here spend roughly two decades of life in poor health. In Burnley, sitting well below the county average on almost every measure, it will be worse still.
What I want done
The mistake everyone makes is treating these as separate problems: a benefits problem, a health problem, a jobs problem. They are one problem, and you cannot fix any link by pulling on it alone.
- Prevention first. The single biggest number in this article is “preventable.” Deaths that need not happen, happening 63% more often. Money spent stopping people getting ill is the cheapest money a government can spend, and the most neglected.
- Get Burnley working by getting Burnley well. The honest route off the welfare bill is not a tighter assessment form. It is health support and real jobs, so fewer people are too sick to work in the first place.
- Fund the front end, or pay at the back. As Cabinet Member for Adult Social Care, I see where this chain ends: in care demand made decades earlier by a town that got sick young. You either invest upstream in health and prevention, or you pay far more downstream in care and lost lives.
- Stop blaming the people in the trap. The data is plain. Burnley’s benefits bill tracks its ill-health, not idleness or fraud. A town does not choose to die three years early. It was let down, over decades, and the people who pay are its own.
I represent part of this town. I am not interested in pretending the welfare numbers are something they are not. They are the visible end of an invisible failure: deprivation that makes people ill, illness that takes their work, and the early grave at the end of it. This did not happen by accident or overnight. It is what managed decline looks like when you measure it in years of life, and it was done to Burnley by an establishment that wrote the place off and moved on. Name the chain honestly, name who let it happen, and you can start to break it.
Where these numbers come from
You do not need this part to follow the story. It is here so the working can be checked. Figures are for the Borough of Burnley (local authority E07000117) unless stated.
- Deprivation: English Indices of Deprivation 2025 (4th of 296, up from 11th in 2019). Children in low-income families 38.3% (DWP/OHID, 2022/23). ONS Health Index 2021 score 85.3.
- Life expectancy and premature mortality: OHID Public Health Outcomes Framework (Fingertips), latest published periods. Life expectancy 2023 to 2025 (male 76.5, female 80.4; England 79.7, 83.5). Under-75 mortality rates are age-standardised per 100,000 for the most recent published periods (preventable 2024; heart disease and cancer 2023 to 2025; respiratory 2022 to 2024; suicide from the OHID profile). Burnley is flagged significantly worse than England on every one.
- The 8.7-year internal gap is OHID’s Slope Index of Inequality in male life expectancy, 2022 to 2024. (A separate local-decile measure puts the male gap as high as 11.5 years.)
- Work and economic inactivity: ONS Annual Population Survey via NOMIS, January to December 2025: employment rate 71.5%, inactivity 27.0%, and 38.8% of the economically inactive (5,500 people) out of work due to long-term sickness, against a Great Britain average of 28.7%.
- Disability (20.6%) is from ONS Census 2021. PIP and Motability figures are from DWP, as set out in my earlier articles.
One honest limit. Healthy life expectancy is not produced at district level, so there is no official Burnley figure and I have not invented one. The figures quoted are for Lancashire as a whole (ONS, 2022 to 2024), and Burnley, being more deprived than the county average, will be worse than that.