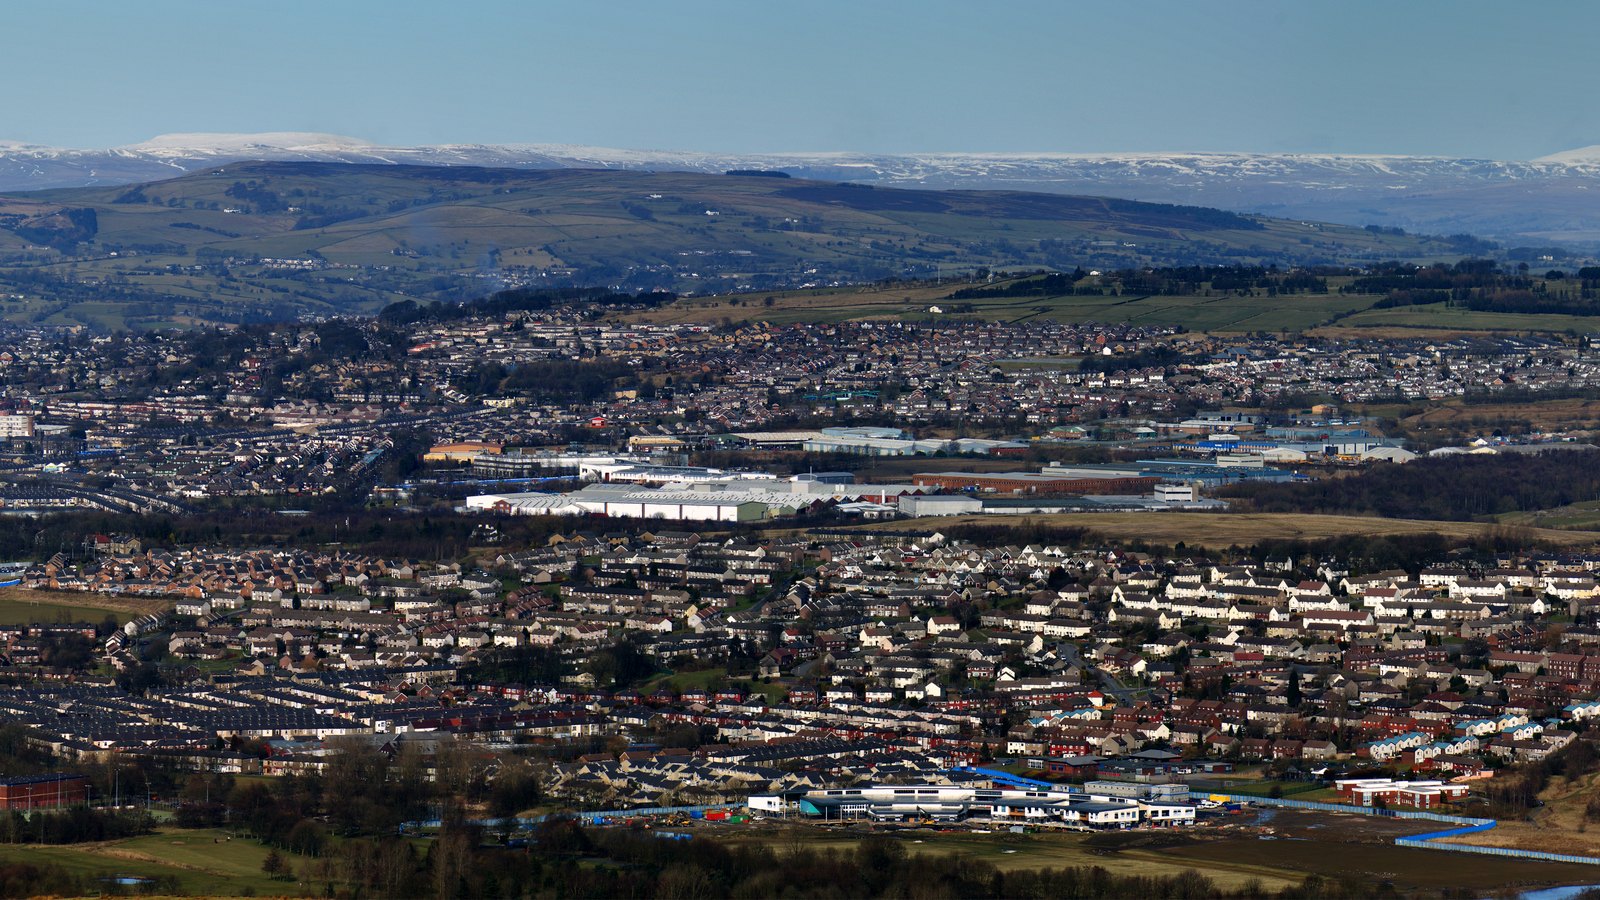
Two things happened to Burnley over the same ten years. The town got bigger, almost entirely because of people arriving from abroad. And it got harder for local people to buy a home here, while the cheap housing was snapped up to rent out. Nobody in Burnley was asked about either. Both were decided in Westminster and Whitehall, and the town is left to live with the result.
1. Inside the buy-to-let boom: how the housing market changed.
2. The names behind the doors: the companies that own the property.
3. More people, fewer homes (you are here): migration, demand and the squeeze.
The people who run the country would rather you did not put those two things in the same sentence. So instead of arguing, I went and got the official numbers for both and laid them side by side. Here they are in full, including what they do not prove. I am not going to insult you by pretending the figures say something other than what they say. Everything below is for the Borough of Burnley, the council area, the same boundary as my other articles, not the parliamentary constituency.
The town got bigger, mostly through migration
Between the 2011 and 2021 censuses, Burnley’s population grew from about 87,000 to 94,600, a rise of 7,578 people. Almost all of that growth was people born abroad. The number of residents born outside the UK rose from 6,734 to 12,058, while the UK-born population barely moved.
So roughly seven in every ten new residents over that decade were born abroad. The share of the town born outside the UK nearly doubled, from 7.7% to 12.7%.
A separate measure tells the same story. Each year, people arriving to work or claim register for a National Insurance number. In Burnley that count sat at around 200 a year through the 2000s and early 2010s, then stepped up sharply from 2016, peaking at 1,141 in 2023 before falling back.
The biggest groups by country of birth in 2021 were Pakistan (4,153 residents), then much smaller numbers from the EU, Poland, Bangladesh and Romania.
At the same time, it got harder to buy a home
I set out the housing side in detail in the first two articles. In short: over the same decade, the typical house price rose by half, the share of homes bought as an investment climbed to more than one in four (the highest in Lancashire), and the cheapest homes, the ones first-time buyers could once afford, all but vanished from the market.
Today about one in four Burnley households rents privately, and the official projection is for home ownership to keep falling. Demand for rented housing is rising. The supply of homes people can actually buy is not keeping up.
Where the pressure meets
The cheap end of Burnley’s housing market is now being competed for from several directions at once:
- Investors buying terraces to rent out, and funds buying the freeholds underneath them.
- A population growing fast, almost all of it from abroad, that needs somewhere to live and, at first, rents.
- The asylum dispersal system. The Home Office, through private contractors on guaranteed money, rents the same cheap terraces that local families and local landlords are chasing and hands them to asylum seekers. Home Office figures show 464 asylum seekers supported in Burnley, about 4.9 for every thousand residents: nearly double the rate across the North West as a whole, and many times the rate in the wealthy South. Every one of those houses is a house a Burnley family cannot rent or buy.
The UK Demographics projection model, looking at Burnley’s mix, reaches a blunt conclusion of its own: high foreign-born population growth “will drive additional housing demand, particularly in the private rented sector.” More demand, the same squeezed supply.
What this does, and does not, show
Two lines rising together is not proof that one caused the other, and I am not going to pretend otherwise.
House prices rose right across the country, for reasons that have nothing to do with Burnley: cheap borrowing, investors chasing returns, and decades of not building enough homes. People who move here, from abroad or from down the road, need a roof like everyone else, and they rent at first because renting is what is available.
This is not about the families who came; most want the same decent life as anyone. It is about a government that waved through record numbers, sent the housing pressure and the bill to towns like Burnley, and never once asked us. That is a failure of national policy, and a deliberate one. Blaming the family looking for a roof is a mistake. Letting Westminster off the hook is a bigger one.
What is fair to say, and what every resident here already knows, is this: a town with almost no spare housing is being made to absorb demand from every direction at once, including decisions taken in Whitehall and imposed on us, and the people who pay for it are Burnley’s own first-time buyers and renters.
What I want done
- Build, and build the right homes. The single biggest lever is supply: more homes people can actually afford to buy, so ownership stops sliding.
- Protect the existing stock. Extend the HMO controls to all 15 wards, and stop the steady conversion of family homes into rentals, as I argued in the first article.
- Stop dumping asylum housing on towns with no room. A borough with some of the scarcest, cheapest housing in England should not be made to carry a heavy share of the nation’s asylum accommodation, competing with its own families for the same terraces. Control the numbers coming in, and stop sending the pressure to the places least able to absorb it.
- Put the numbers in front of people. Population, housing and ownership data for Burnley should be published together and kept up to date, so the debate is about facts, not feelings.
I grew up here. I want it to stay a place where local people can afford to put down roots. That means being straight about every pressure on its housing, and then doing something about the ones we can actually control.
Where these numbers come from
You do not need this part to follow the story. It is here so the working can be checked. All of it is official, public data.
Every figure is for the Borough of Burnley (local authority area E07000117), the same boundary used across this series, so the population numbers line up with the housing numbers in the other articles. The underlying data also exists at parliamentary-constituency and ward level; I have deliberately stuck to the borough so everything compares like with like.
- Population and country of birth: ONS Census 2011 and 2021, for the Borough of Burnley, via the UK Demographics dataset.
- New National Insurance numbers issued to overseas nationals: DWP, by local authority, 2002 to 2025. This is a flow measure (new registrations each year, issued once per person), not a running total, and it undercounts anyone who never registers.
- Tenure (who owns and who rents): ONS Census 2021. The forward projection of falling home ownership is from the UK Demographics model (Census 2021 tenure by ethnicity combined with population projections), and is an estimate, not a certainty.
- Asylum accommodation: Home Office figures for asylum seekers in receipt of support, by local authority (end of 2024). The regional comparison (the North West, and the lower rate in the South) is from the House of Commons Library asylum statistics briefing, which calculates supported asylum seekers per 10,000 population by region: the North West sat at over 26 per 10,000, against Burnley’s 49.
- House prices and investment-buying: HM Land Registry, as set out in the earlier articles.
Two honest limits. First, these are different measures on slightly different timescales, lined up to show direction, not to prove cause. Second, “born outside the UK” and “arrived recently” are not the same thing: many non-UK-born residents have lived in Burnley for decades. The figures describe a town that is changing and under housing pressure. They do not, on their own, assign blame, and neither do I.