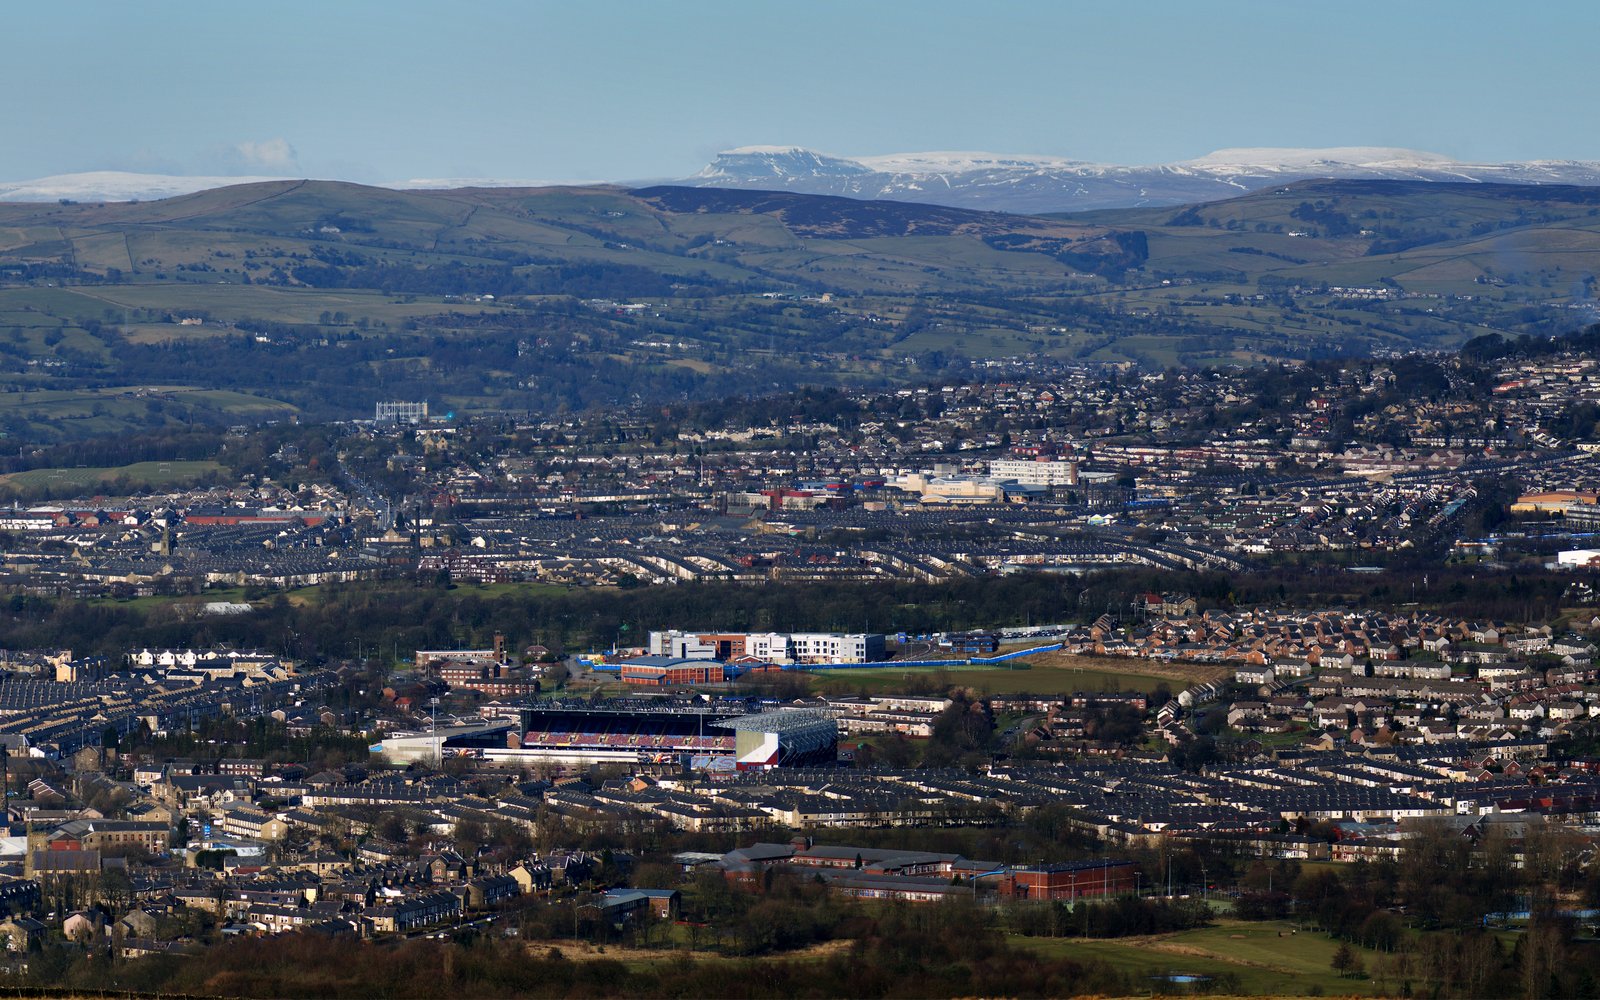
When a house is sold in England, the sale goes onto a public record. So does every company, and the people behind it. Nobody usually puts all of that together for one town. So I did, for Burnley.
1. Inside the buy-to-let boom (you are here): how the housing market changed.
2. The names behind the doors: the companies that own the property.
3. More people, fewer homes: migration, demand and the squeeze.
I went through every house sale here from 2015 to 2025, all 21,720 of them. I looked at the 5,775 companies registered to a Burnley postcode, and the council’s own research into shared housing. You do not need to be an expert to see what it shows, and I am going to keep it simple. Burnley is being quietly bought out from under the people who live here, and most of them have no idea it is happening.
One thing up front. When I say Burnley, I mean the borough: the council area that covers the town plus Padiham, Worsthorne, Cliviger, Hapton, Briercliffe and the villages around it, not the parliamentary seat. Exactly which boundary each figure uses is set out at the bottom.
This is not a complaint about people putting money into Burnley. Money coming into a town is a good thing. The worry is the pattern underneath it: bit by bit, Burnley is turning from a place people buy to live in, into a place people buy to rent out.
House prices have shot up
In 2015, the typical Burnley home sold for about £72,000. By 2025 it was £110,000. In plain terms, prices went up by half in ten years.
If you already own your home, a higher price feels like good news. If you are trying to buy your first one, it is the opposite. And the cheaper houses, the ones a young couple might just about stretch to, are vanishing fastest.
Back in 2015, a third of all the homes sold in Burnley went for under £50,000. By 2025, only about one in thirteen did. Those cheap terraced houses did not disappear. They got bought up to be rented out. There were still 15 homes sold for under £30,000 in Burnley in 2025, and the cheapest changed hands for £350. Nobody is buying a £350 house to raise a family in.
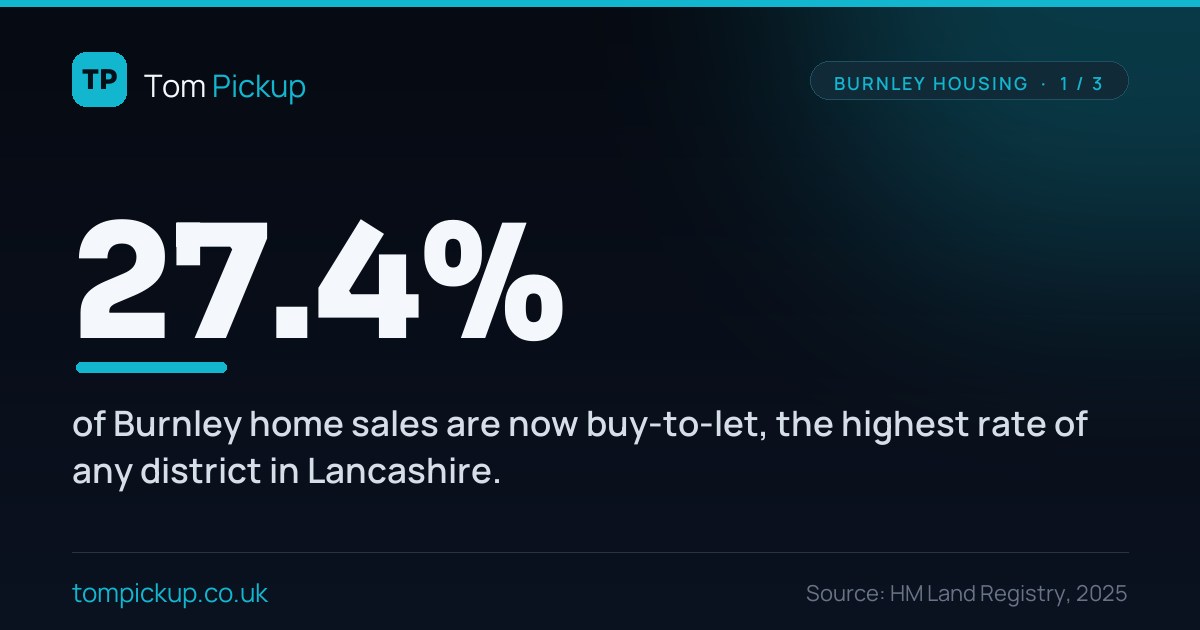
More homes here are bought to rent out than anywhere else in Lancashire
Every house sale comes with a marker showing, roughly, whether the home was bought in the normal way to live in, or as an investment to rent out or flip. In Burnley, the share bought as an investment has climbed from about one in six sales in 2015 to more than one in four in 2025.
That is the highest rate of any district in Lancashire. More of Burnley is being bought to rent out than anywhere else in the county.
Oddly, the classic move, a cheap house under £50,000 snapped up to rent out, has actually fallen, from 336 of them in 2017 to 88 in 2025. Not because landlords lost interest, but because there are barely any cheap houses left to buy.
And more of them are being bought by companies
It is not just individual landlords any more. More and more, Burnley homes are bought by companies set up specifically to own property.
A decade ago, about 14 of these property companies were registered to a Burnley postcode each year. Lately it has been around 92 a year, with more than 500 active right now. In the town centre, the BB11 postcode, it went from 1 a year to 36.
Here is the simplest way to picture the change. In 2015, there was roughly one new property company for every 115 house sales in the borough. By 2025, there was one for every 19. (Companies are counted by postcode and sales by borough, so treat this as an illustration of the trend rather than an exact ratio. More on that at the bottom.)
A town moving at two speeds
The boom is not the same everywhere. Some parts of Burnley have shot up in price. Others have barely moved. Between 2020 and 2025, homes in the BB10 and BB11 areas rose by about half. In BB12, they went up just 4.5%.
One town, two completely different housing markets. And on some streets, the change is almost total. In 2025, every single home sold on Penistone Street, Dall Street and Wren Street was bought as an investment, not by someone moving in. On Reed Street it was nine out of ten.
Homes are changing hands faster, too. 252 addresses in Burnley were sold four times or more in eleven years. In 1,806 cases, a home was sold again within a year of being bought. That is the pattern of a market being traded, not lived in.
The shared houses nobody is counting
The sharpest end of all this is the shared house, or HMO, where one family home is split up so several people rent rooms in it. Done well, it is housing the town needs. Done badly, it means overcrowding, fire risk and real pressure on a street.
The council’s own research, carried out by an independent housing body in 2023, estimated there are about 916 of these in Burnley. Here is the worrying part. The council only officially knew about 400 of them. The other 516 were estimated to exist but sat on no register at all.
There is a tool that helps. It is called an Article 4 Direction, and in plain terms it means a landlord has to ask the council for permission before turning a family home into one of these shared houses. Burnley brought one in, in October 2024. But it only covers 9 of the town’s 15 wards. Those nine hold the bulk of the problem, an estimated 775 of the 916 shared houses, while the other six have no such protection. They hold an estimated 141 between them, and they are where the next wave of conversions will go once the inner wards are locked down.
| Ward with no protection | Estimated shared houses |
|---|---|
| Lanehead | 44 |
| Hapton with Park | 32 |
| Briercliffe | 22 |
| Whittlefield with Ightenhill | 17 |
| Cliviger with Worsthorne | 14 |
| Coal Clough with Deerplay | 12 |
I have since looked at Burnley’s shared houses in detail, including the gap between the official count and the real one, in The Shared Houses Burnley Cannot See.
What I want done
None of this is against the law. It is what happens when the cheapest houses in Lancashire meet investors looking for a return, and a system that leaves the door wide open. But a town has a right to know what is being done to its own streets, and a council has a duty to keep up. For too long, nobody did.
Three things follow from the numbers:
- Protect all 15 wards, not 9. There is no good reason six wards are left out of the protection the other nine already have, especially when they are where the next conversions are likely to land. I back extending it, and my colleague Cllr Liam Thomson has been pressing the same case.
- Find the missing 516. More than half the town’s estimated shared houses are on no register. A house the council cannot see is a house it cannot check for safety, overcrowding or basic standards.
- Name the owners. The ownership records are public. People are entitled to know who owns the streets they live on. I have now published the first cut: The Names Behind the Doors.
I grew up here. A town where local people can no longer afford to buy the house they grew up in, because investors and faraway funds got there first, is a town being taken from the people who built it. The first step to stopping that is being honest about its size. The records are public. I just put them in one place, where the people of Burnley can finally see what is happening to their own town.
Where these numbers come from
You do not need this part to follow the story above. It is here so anyone who wants to check the working can. Everything in this article comes from public records that anyone can look up.
A quick word on geography. When I say Burnley I mean the Borough of Burnley, the council area, not the parliamentary constituency and not only the town centre. It covers the town plus Padiham, Worsthorne, Cliviger, Hapton, Briercliffe and the villages around them. The house sales, prices, street examples, wards, shared-housing figures and the Lancashire comparison all use that borough boundary. The company figures are the one exception. They cover every company whose registered office sits in a Burnley postcode, BB10, BB11 or BB12, which match the borough closely but are drawn by postcode rather than the council line. So where I set companies against sales, like the rough one-property-company-for-every-19-sales figure, read it as an illustration of the trend, not an exact like-for-like.
- House sales and prices come from HM Land Registry’s record of every property sold in England, filtered to the Burnley district (the borough). I used every Burnley sale from 2015 to 2025, which is 21,720 of them.
- Companies come from Companies House, the official register of every UK company. I used all 5,775 companies whose registered office is in a Burnley postcode (BB10, BB11 or BB12), as listed in May 2026.
- Shared houses come from the council’s own evidence base: a 2023 study by the Building Research Establishment, an independent housing research body, prepared to support Burnley’s Article 4 decision.
- The Lancashire comparison uses the same Land Registry measure applied to each district, so it is a fair like-for-like.
A few plain definitions:
- “Bought to rent out” / “bought as an investment.” When a home is sold, the Land Registry records whether it was a standard purchase or what it calls a “Category B” sale, which covers buy-to-let, auction and other non-standard purchases. It is the closest public measure of a home being bought as an investment rather than to live in. It is not perfect, but it is recorded the same way across the whole country, so comparing one area with another is fair.
- “Typical price” means the median: the middle price when you line every sale up from cheapest to dearest. It is a better guide than a simple average, because a handful of very expensive sales cannot drag it up.
- “Property company” means a company that Companies House lists under real estate (industry code 68): firms set up to buy, own, rent or manage property.
- “HMO” stands for house in multiple occupation: a house rented out room by room to several people who are not one household.
- “Article 4 Direction” is a planning rule a council can bring in so that turning a family home into a shared house needs permission first, instead of happening automatically.
Two honest caveats. The 916 and 516 shared-house figures are estimates from the 2023 study, not an exact count, which is rather the point, because nobody knows the true number. And the company figures describe the public registers as they stand today. Naming the specific companies and people who own Burnley property, street by street, needs a separate Land Registry dataset, and that is the next piece I am working on.