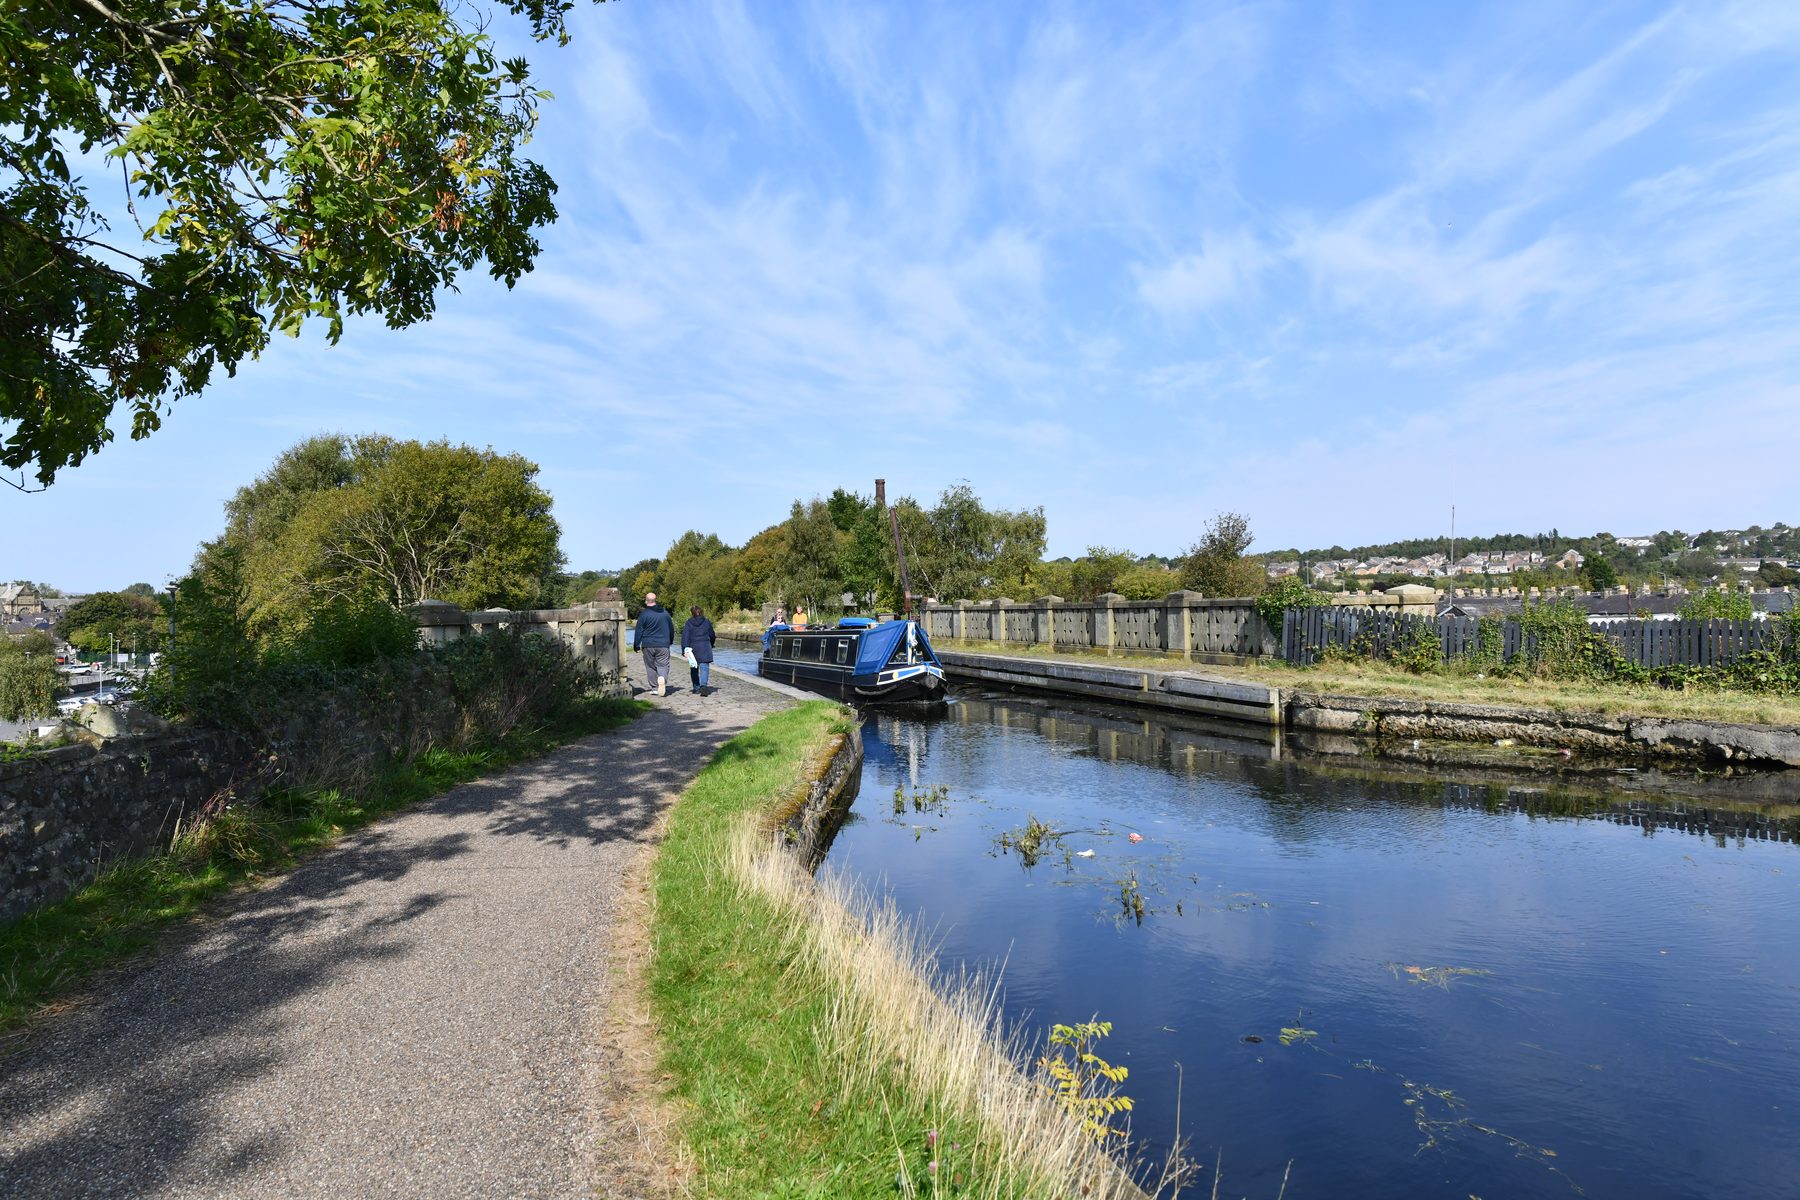
When you pay rent in Burnley, where does the money actually end up? More and more of it goes to a company rather than a person. A surprising amount of it is public money, taken from the taxpayer and passed straight to private landlords. And the part the state pays has been frozen while rents keep climbing, so the gap is left on the people who can least afford it. Here is how it works, and who profits.
Rents are rising, and most renters pay a private landlord
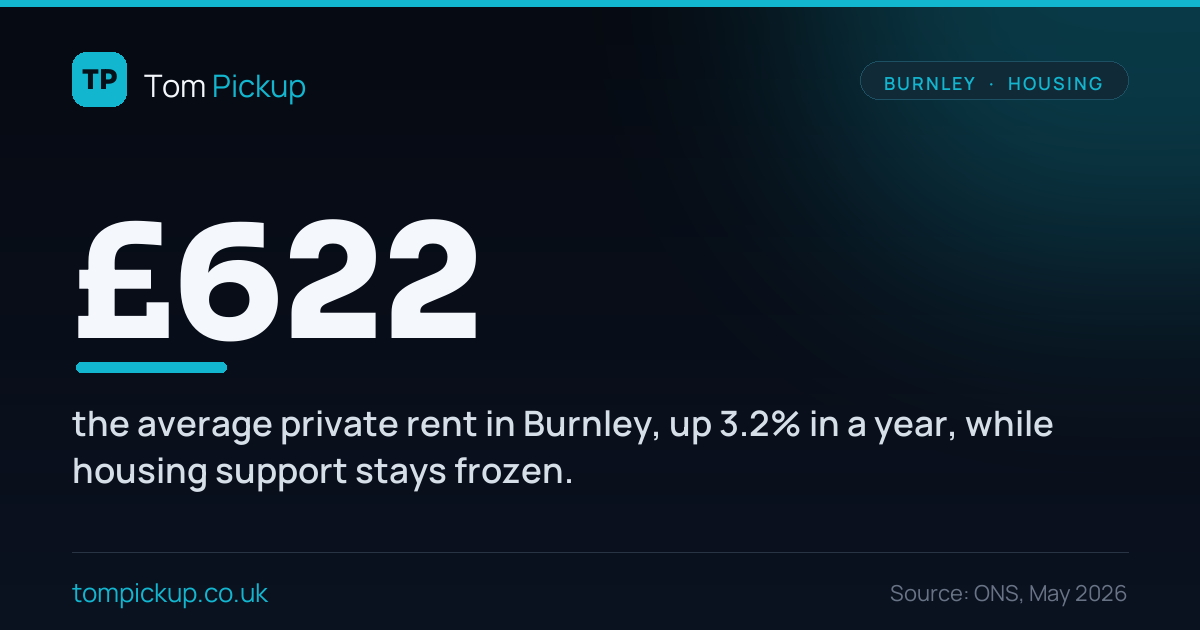
The average private rent in Burnley is now about £622 a month, and it rose 3.2% in the last year. Rents here have climbed steadily, year after year, in one of the cheapest towns in the country.
About one household in four here rents privately, 9,696 of them, and the large majority, 8,621, rent from a private landlord or letting agency rather than a housing association or the council. So when rents go up, it is private landlords who collect the increase, and a growing share of the town that pays it. The private rented sector in Burnley grew faster than any other type of housing in the decade to 2021.
A lot of that rent is public money
Here is the part most people do not realise. A big slice of Burnley’s private rent is not paid by tenants out of their wages. It is paid by the taxpayer, through housing benefit and the housing part of Universal Credit, and then handed straight to the landlord.
In a town where 18,581 working-age adults, nearly 30% of them, are on Universal Credit, that flow is large. The amount the state will pay is capped by the Local Housing Allowance. For Burnley, which sits in the West Pennine rental area, the most it will put toward a two-bedroom home is £103.56 a week, around £450 a month. That is public money going, via the tenant, straight into a private landlord’s account. When the council last broke the figures down, in 2023, far more of Burnley’s Universal Credit housing support was going to private landlords than to social housing.
So “where your rent goes” has two answers. For a working renter, it goes from your wages to your landlord. For a great many others, it goes from the taxpayer to the same landlord. Either way, it increasingly ends up with the companies and funds I traced in my earlier articles: the 2,783 companies that own Burnley property, and the freehold funds that own the ground beneath it.
The help is frozen. The rent is not.
The catch is that the public help has stopped keeping up.
After a one-off rise in April 2024, the government froze the Local Housing Allowance again in cash terms, and has held it frozen for 2026/27 too. Rents, as we have seen, did not freeze. When the help stands still and the rent keeps climbing, the difference does not vanish. It is pushed onto the tenant, and it grows every year.
On a two-bedroom home in the Burnley area, that gap is now about £126 a month, on the Institute for Fiscal Studies’ figures. For a family already on a low income, that is £126 a month that has to come out of money meant for food, heating and everything else, just to keep a roof up. It is one of the quiet engines of the cost-of-living squeeze here, and of the rising homelessness I wrote about in the empty homes piece. On current policy it is set to keep widening.
What I want done
- Build genuinely affordable homes. The lasting fix is more homes people can afford to rent and buy, so fewer families are left at the mercy of a frozen benefit in a rising market.
- Make the help realistic. Freezing Local Housing Allowance while rents rise is a cut by stealth, and it falls hardest on the poorest. The link between the help and actual local rents should be restored.
- Make public money buy decent housing. Where the taxpayer is funding the rent, the home should be fit. Burnley’s new selective licensing, which I support, should be used to hold landlords to a real standard, not just to collect a fee.
- Keep the money in the town. Backing leasehold and ground-rent reform, and naming who owns what, helps stop rent and fees leaking out of Burnley to distant funds, as my earlier articles showed they do.
Rent is the biggest bill most households here pay, and for the taxpayer it is one of the biggest housing costs going. Be honest about where it ends up: increasingly in the hands of companies and funds based nowhere near Burnley, propped up by public money, while the people who actually live here and the taxpayer carry the cost. That is not a market working. It is a town being quietly milked.
Where these numbers come from
You do not need this part to follow the story. It is here so the working can be checked.
Figures are for the Borough of Burnley (local authority E07000117), except the Local Housing Allowance, which is set for the West Pennine Broad Rental Market Area that covers Burnley.
- Average private rent (£622 a month, up 3.2%) is from the ONS Price Index of Private Rents, May 2026, for Burnley local authority. It is a modelled average across all property sizes.
- Renting households (9,696 private renters, 8,621 from a private landlord or agency; about one in four) are from ONS Census 2021. Private renting grew faster than any other tenure between the 2011 and 2021 censuses.
- Universal Credit (18,581 people, nearly 30% of those aged 16 to 65) is from DWP, February 2026, via Lancashire County Council’s Lancashire Insight. The 2023 split showing more Universal Credit housing support going to private than social renters is from Burnley Borough Council’s Private Rented Sector Forum, January 2024.
- Local Housing Allowance (£103.56 a week for a two-bedroom home) is the West Pennine area rate for 2025/26, set by the Valuation Office Agency (gov.uk Local Housing Allowance tables). Rates were reset to the 30th percentile of local rents in April 2024 and then frozen in cash terms for 2025/26 and 2026/27.
- The shortfall (about £126 a month on a two-bed) is the Institute for Fiscal Studies’ estimate of the gap between the frozen Local Housing Allowance and the 30th-percentile two-bedroom rent in the West Pennine area, November 2025. The Resolution Foundation puts the national two-bedroom gap on a similar upward path.
- Company and freehold ownership figures are from HM Land Registry, as set out in my earlier articles.
Two honest caveats. Average rents cover all property sizes, so a specific two-bedroom home may cost a little more or less than £622. And not every renter receives housing support, while some receive less than the full Local Housing Allowance because of their circumstances. The point is not that every pound of Burnley rent is public money. It is that a large and growing share of it is, that the support has been frozen while rents rise, and that more and more of the total ends up with companies rather than local people. There is no single published figure for total housing-support spending in Burnley, so I have not invented one.