There is a number that gets thrown around a lot in the welfare debate, usually with a sneer attached. So I went and got the real figure for my home town, and the real reason behind it.
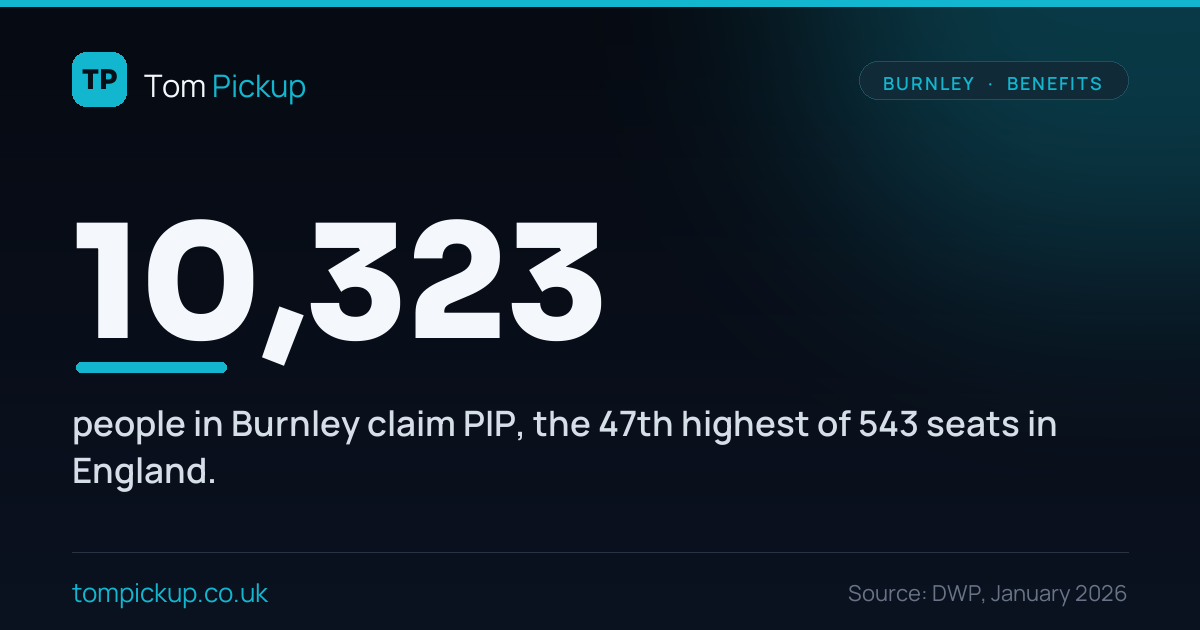
More than ten thousand people in Burnley now claim Personal Independence Payment, the main disability benefit. Out of 543 parliamentary seats in England, only 46 have more. That is not a story about people who will not work. It is the bill for what was done to this town: the mills closed, the work was never replaced, and a string of governments in London managed the decline and looked away. Burnley is paying for their choices in its health.
What PIP actually is
Most people get this wrong, so it is worth being clear. PIP is not an out-of-work benefit. It is not the dole. It is paid to people with a long-term illness or disability to help with the extra costs that come with it, and you can claim it whether you work or not. Plenty of people on PIP have a job. It exists because being disabled is expensive, and that does not change when you clock on.
So a high PIP count does not mean a town full of people dodging work. It means a town with a lot of long-term illness and disability. And on that measure, Burnley has more than almost anywhere.
Why the number is so high here
The reason is not a mystery. It is the same reason that runs through everything else about this town.
Burnley is the 4th most deprived district in England on the 2025 deprivation index. Forty per cent of its neighbourhoods are in the most deprived tenth of the entire country. Deprivation and ill-health travel together: people in poorer places get sick younger, stay sick longer and live fewer years in good health. That is not a Burnley failing. It is the long tail of what happened to mill towns when the mills closed.
This is the part the national debate skips. When ministers talk about the PIP bill rising, they talk as if the numbers fell from the sky. They did not. They are highest in exactly the places Westminster hollowed out and never rebuilt: the mill towns, the coalfields, the post-industrial North. The same establishment that let the work go now tuts at the benefits bill it created. Burnley is one of those places, and it is owed better than a sneer.
It is also a cost-of-living story
For a lot of people here, PIP is the difference between coping and not. It often goes on the basics that illness makes dearer: heating a home you are stuck in all day, running equipment, paying for transport to hospital, eating a diet your condition requires.
The wider picture in Burnley is bleak. Nearly 30% of working-age residents are on Universal Credit. About one household in six, 16.2%, is in fuel poverty, among the highest rates in Lancashire. Set that against rising rents and bills, and PIP is not pocket money. It is what keeps a lot of disabled and seriously ill people in Burnley afloat.
And big changes are coming
The cost of PIP has roughly doubled in seven years. Across England and Wales, the number of people receiving it climbed from 2.05 million in 2019 to around 4 million in 2026, and that rising bill is what put it in the Treasury’s sights.
This matters now because the government spent most of 2025 trying to cut it. The plan was to tighten PIP eligibility so that fewer people qualified for the daily living payment. After a large backbench rebellion, ministers pulled the PIP changes out of the bill on 1 July 2025, and parked any reform until a full review of the assessment, led by the minister Sir Stephen Timms, reports in autumn 2026.
So nothing has changed yet, but the review is coming, and when it lands it will decide the future of a payment that more than ten thousand Burnley residents rely on. A town with the 47th highest caseload in England has more skin in that game than almost anywhere. It should be heard before the rules are rewritten, not after.
The bit that lands on my desk
I am the Cabinet Member for Adult Social Care at Lancashire County Council. The same forces that drive Burnley’s PIP numbers, long-term illness, disability and an ageing population, are exactly what drives demand for the care services I am responsible for. PIP claims and care needs are two readings of the same underlying fact: this is a county with a lot of people who are not well. You cannot budget for one while pretending the other is a scandal.
What I want done
- Be honest about the cause. Burnley’s PIP bill is high because Burnley is sick and poor, not because it is idle. Reform built on the wrong diagnosis will hurt people who genuinely need the help.
- Reform what is actually broken. Where there is fraud or error, deal with it. Where there is a clumsy, stressful assessment process, fix that. Do not cut the payment and call it a fix.
- Tackle the root, not just the bill. The lasting way to bring this number down is better health, real prevention and decent jobs in towns like this one, not a tighter form.
- Test national changes against towns like Burnley. Any change from the Timms review should be modelled on the places with the most claimants before it becomes law, not justified by a national average that hides them.
The honest version of this story is less satisfying than the sneer, but it is the true one. Ten thousand of my neighbours are on PIP because this is one of the most deprived, least healthy towns in the country, and it did not get that way by accident. The answer is to rebuild it, with real jobs, real health and real investment, not to balance Westminster’s books on the backs of sick people in a town it abandoned.
Where these numbers come from
You do not need this part to follow the story. It is here so the working can be checked.
- The Burnley figure of 10,323 is from DWP PIP statistics (Stat-Xplore), cases with entitlement, January 2026, for the Burnley parliamentary constituency (2024 boundaries).
- The rank and the comparison are worked out across all 543 English constituencies in the same dataset: Burnley is 47th highest, against an average of 6,688 and a median of 6,212. That is where “54% above the typical seat” and “top 9%” come from.
- The national figures are from DWP PIP statistics: nearly 4 million people across England and Wales received PIP by April 2026, roughly double the 2.05 million in January 2019.
- Deprivation is from the English Indices of Deprivation 2025, on which Burnley is the 4th most deprived district in England, with 40% of its neighbourhoods in the most deprived tenth nationally.
- Universal Credit (about 30% of working age) and fuel poverty (16.2%, 2023, the latest available) are from DWP and government fuel poverty statistics, for the Borough of Burnley.
- The reform timeline is from the Universal Credit and Personal Independence Payment Act 2025 and the announced terms of the Timms review of the PIP assessment.
Two honest caveats. First, the geography: the PIP figure is for the parliamentary constituency, while the deprivation, Universal Credit and fuel poverty figures are for the borough. They cover almost the same place but are not identical, and I have labelled each. Second, a high PIP caseload reflects both genuine need and the fact that more eligible people are claiming what they are entitled to. Neither of those is something to apologise for.